Data4Lyf
An Accessibility Analysis of Real-World Websites
A data-driven analysis of real-world web accessibility failures combining exploratory analytics, machine learning, severity-based prioritization, clustering, and Power BI to identify systematic barriers and translate them into actionable remediation priorities.
3,524
Violation Records
~590
Web Pages
5
K-Means Clusters
~80%
Remediation Coverage
01 · Problem
Technology is intended to be inclusive. Digital experiences often are not.
Accessibility barriers are often invisible to designers and developers but can create substantial challenges for people who rely on screen readers, keyboard navigation, or accessible visual design.
The project analyzed real-world website accessibility violations to understand where failures occur most frequently, which types of violations dominate, and which pages may create the greatest accessibility barriers.
Rather than optimizing for model complexity, the team focused on interpretability, human impact, severity-based prioritization, and recommendations organizations could act on.
02 · Data & Preparation
Turning raw accessibility records into an analytical dataset
The AccessGuru dataset contained 3,524 accessibility violation records across approximately 590 unique web pages. The data included domain categories, violation types, accessibility categories, severity indicators, impact labels, and page identifiers.
Standardized categories
Normalized inconsistent domain labels to create comparable categories across the dataset.
Removed failed scrapes
Excluded unsuccessfully scraped pages before analytical aggregation.
Aggregated page-level patterns
Grouped violations at page and domain levels to support comparative analysis and clustering.
Validated severity fields
Checked consistency between violation scores and impact labels before using them for prioritization.
Analytical assumption: the dataset represents reported violations, so findings describe patterns in the observed dataset rather than a complete census of all accessibility failures on the web.
03 · Exploratory Analysis
Where does digital accessibility fail most?
Exploratory analysis revealed that accessibility failures were not evenly distributed. Domain type and recurring implementation patterns both influenced the observed accessibility burden.
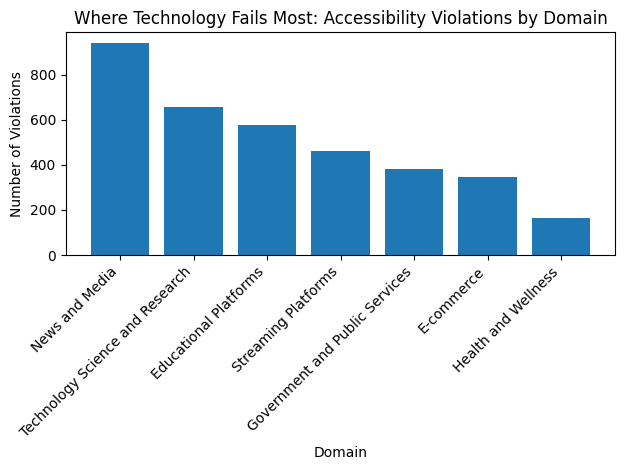
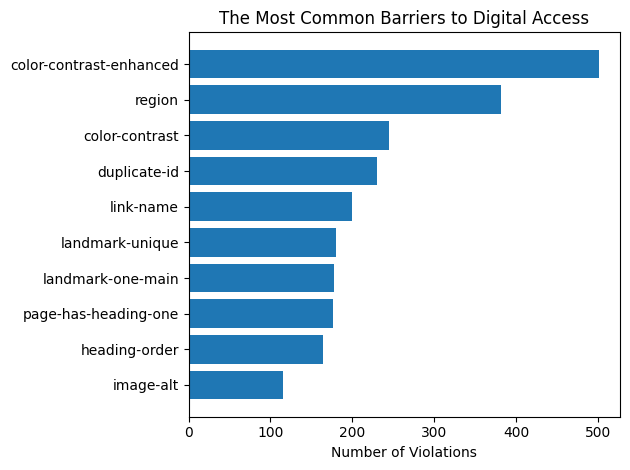
Accessibility failures were unevenly distributed
News & Media showed the highest observed concentration of accessibility violations in the analyzed dataset, highlighting how accessibility risk can vary substantially across digital domains.
A small set of barriers appeared repeatedly
Color contrast, landmarks and regions, duplicate IDs, link names, and heading structure emerged as recurring accessibility problems across industries.
Syntactic violations dominated
Most observed violations were syntactic, while semantic issues occurred less frequently but were concentrated particularly in Education and Technology.
Severity changed remediation priorities
Raw violation counts alone did not capture user impact, so the analysis incorporated severity-weighted prioritization to identify pages where remediation could matter most.
04 · Decision Intelligence
Severity matters more than volume
A page with fewer violations can still create greater accessibility barriers if those violations are more severe. The analysis therefore introduced a severity-weighted Risk Score to complement raw violation counts and help prioritize remediation.
The objective was not simply to identify which pages had the most errors, but to translate accessibility data into a more useful prioritization mechanism.
Severity-Weighted Risk Score
The scoring framework converts violation severity into a prioritization signal so teams can focus remediation where accessibility impact may be greatest.
05 · Machine Learning
Extending descriptive analytics with machine learning
The project explored machine-learning approaches for identifying violation types, predicting accessibility impact, and detecting recurring page-level failure patterns.
01
Violation Type Prediction
Combined affected HTML elements and violation descriptions into text features, then used TF-IDF with a Random Forest classifier across common violation classes.
02
Impact Prediction
Used encoded violation type, violation count, domain category, and violation score as features for a Random Forest model predicting accessibility impact.
03
Pattern Discovery
Aggregated violation profiles at the page level, standardized features, and applied K-Means clustering to identify recurring accessibility failure patterns.
06 · Pattern Discovery
Accessibility problems formed recurring families
K-Means clustering with k=5 was applied to standardized page-level violation profiles. The resulting silhouette score was 0.334, indicating moderate separation in the observed real-world data.
0.334
Silhouette Score
5
Clusters
01
Contrast-Heavy Pages
Pages dominated by color-contrast violations, creating significant barriers for users with low vision.
02
Navigation Confusion
Pages with missing landmarks and regions that make orientation and navigation harder for screen-reader users.
03
Structure-Broken Pages
Pages with duplicate IDs and structural HTML problems that can interfere with assistive technologies.
04
Heading Disorder
Pages with incorrect heading hierarchy that make content structure harder to understand and navigate.
Analytical implication
Recurring problem families suggest that accessibility remediation can be approached systematically. Instead of treating every violation as an isolated defect, teams can build repeatable remediation patterns around common failure modes.
07 · Business Intelligence Layer
Translating analysis into an interactive decision layer
Power BI was used to validate and communicate the analytical findings through an interactive dashboard that allowed users to explore domain-level accessibility patterns, common violations, and page-level risk.
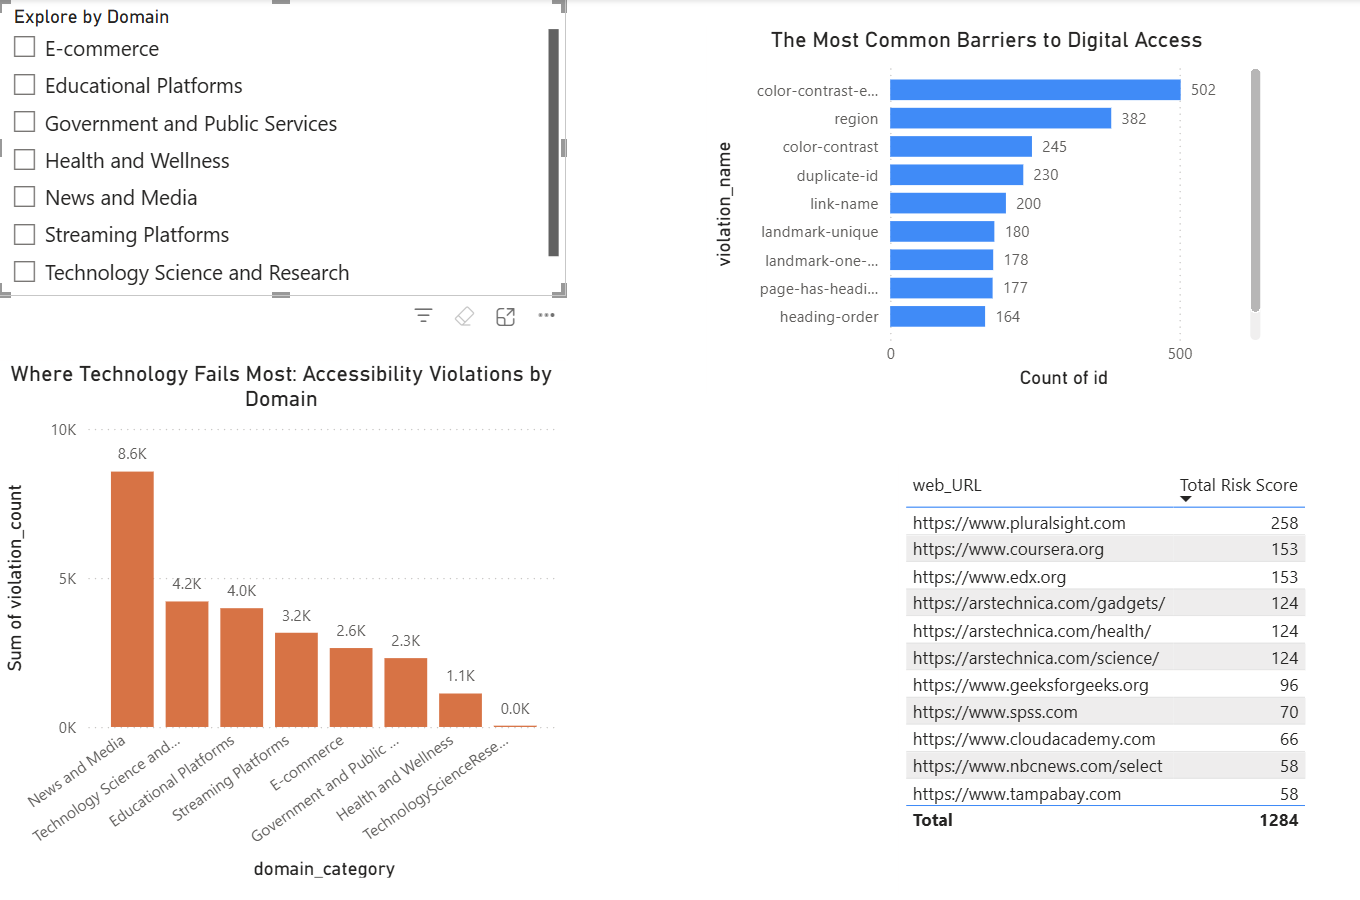
Domain Exploration
Filter accessibility findings across website categories.
Barrier Analysis
Identify recurring violation types within selected domains.
Risk Prioritization
Surface individual pages with higher severity-weighted risk.
08 · Human Impact
The data represents barriers experienced by real people
The analysis connected technical violations to the users most likely to experience their consequences, keeping human impact at the center of the analytical interpretation.
Color contrast
People with low vision
Text and interface elements can become difficult or impossible to perceive.
Missing link names
Screen-reader users
Links can lose meaningful context or purpose.
Missing landmarks
Blind and screen-reader users
Page orientation and navigation can become substantially harder.
Duplicate IDs
Assistive technology users
Page structure can be interpreted incorrectly by assistive technologies.
09 · Recommendations
Four remediation practices address nearly 80% of observed violations
The analysis translated recurring failure patterns into a practical remediation roadmap. Together, these four categories covered 2,802 of the 3,524 observed violation records.
79.5%
of observed violation records covered by the four recommended remediation categories
Fix color contrast
747 violationsEnforce WCAG contrast requirements and integrate automated contrast testing into design and CI workflows.
Add semantic landmarks
869 violationsUse semantic elements such as nav, main, and footer consistently to improve assistive navigation.
Ensure meaningful link text
423 violationsReplace vague link labels with descriptive actions and destinations and provide appropriate alternative text for linked images.
Validate HTML structure
763 violationsMaintain unique IDs and logical heading hierarchy to improve structural interpretation by assistive technologies.
10 · What I Demonstrated
From raw data to decision-ready insight
Data Analysis
Cleaned, standardized, aggregated, and interpreted a real-world accessibility dataset.
Machine Learning
Applied TF-IDF, Random Forest classification, feature encoding, standardization, and K-Means clustering.
Business Intelligence
Translated analytical outputs into an interactive Power BI decision layer.
Human-Centered Analytics
Connected technical accessibility defects to their potential consequences for people using assistive technologies.
Decision Frameworks
Moved beyond raw counts by incorporating severity and remediation prioritization.
Executive Communication
Converted technical findings into concise patterns, implications, and actionable recommendations.
11 · Technical Stack
Analysis
Python
Pandas
NumPy
Machine Learning
Scikit-learn
Random Forest
K-Means
Feature Engineering
TF-IDF
Label Encoding
StandardScaler
Visualization
Power BI
Python Visualization
Project Note
This project was developed by Sunayana Hazarika for the DubsTech Datathon 2026 Technology Track. Findings represent patterns in the supplied AccessGuru dataset and should not be interpreted as a comprehensive accessibility assessment of the organizations or websites represented in the dataset.