AIMS Product Competition 2026
KitchenGuide
FreshOps AI — Real-Time Kitchen Decision Assistant for Fast-Casual Restaurants
An AI-driven decision automation concept designed to help regional restaurant chains reduce perishable food waste by converting demand signals into real-time kitchen preparation guidance.
Competition case-model assumptions & projections
~$1.5M
Annual Waste Exposure
Modeled for a 40-location regional chain
25%
Waste Reduction
Modeled product impact assumption
~2.6×
Customer ROI
Based on competition pricing model
~$5.4M
Year-3 ARR
Modeled at 1,500 stores
01
The Problem
Fast-casual restaurants already generate substantial operational data through POS systems, inventory platforms, and forecasting tools. Yet food waste can still occur because those systems often describe what happened rather than guide the frontline decision being made during service.
The core insight
Waste is not simply a data-visibility problem. It is a real-time decision uncertainty problem.
Managers and kitchen staff must continuously balance two competing risks: preparing too much creates waste, while preparing too little creates stockouts and service delays. KitchenGuide was designed to intervene at that decision point.
02
Designed Around Three Operational Users
Regional Operations Manager
Oversees roughly 40 locations and needs scalable visibility into waste, margins, adoption, and operational consistency.
Store Manager / Shift Lead
Makes ordering and preparation decisions while balancing service speed, availability, and waste.
Kitchen Staff
Needs simple, immediate guidance during service without stopping to interpret analytics.
03
From Analytics to Decision Automation
We evaluated forecasting tools, waste-tracking systems, auto-ordering, and training-based approaches. Each addresses part of the problem, but none directly resolves the moment when kitchen staff must decide whether to prepare another batch.
Product Positioning
We are not an analytics tool.
We are a decision automation layer.
KitchenGuide converts operational data into direct actions so that insights are delivered when they can still change the outcome.
04 · Product Workflow
Predict → Guide → Learn
Before Opening
Predict & Plan
Forecast demand by ingredient, calculate appropriate quantities, adjust reorder points, and flag overstock risk.
During Service
Guide Live Prep
Compare actual sales with expected demand and translate the signal into simple Prep Now, Wait, or Reduce Batch actions.
After Closing
Learn & Improve
Review waste cost and over-preparation patterns, then feed those signals back into future planning.
05
Three-Layer Product Architecture
The concept connects strategic oversight, frontline execution, and an underlying intelligence layer rather than treating them as separate tools.
Regional Manager Dashboard
Control layer for comparing stores, identifying adoption gaps, monitoring waste, and tracking margin improvement.
Kitchen Display Tablet
Execution layer that delivers clear operational guidance to frontline teams during service.
Prediction & Decision Engine
Intelligence layer that processes demand signals and generates forecasts, optimized quantities, and live recommendations.
Manager controls → Kitchen acts → System learns
06
Prototype Experience
The MVP translated the product strategy into interfaces for both regional operations management and AI-supported operational decision-making.
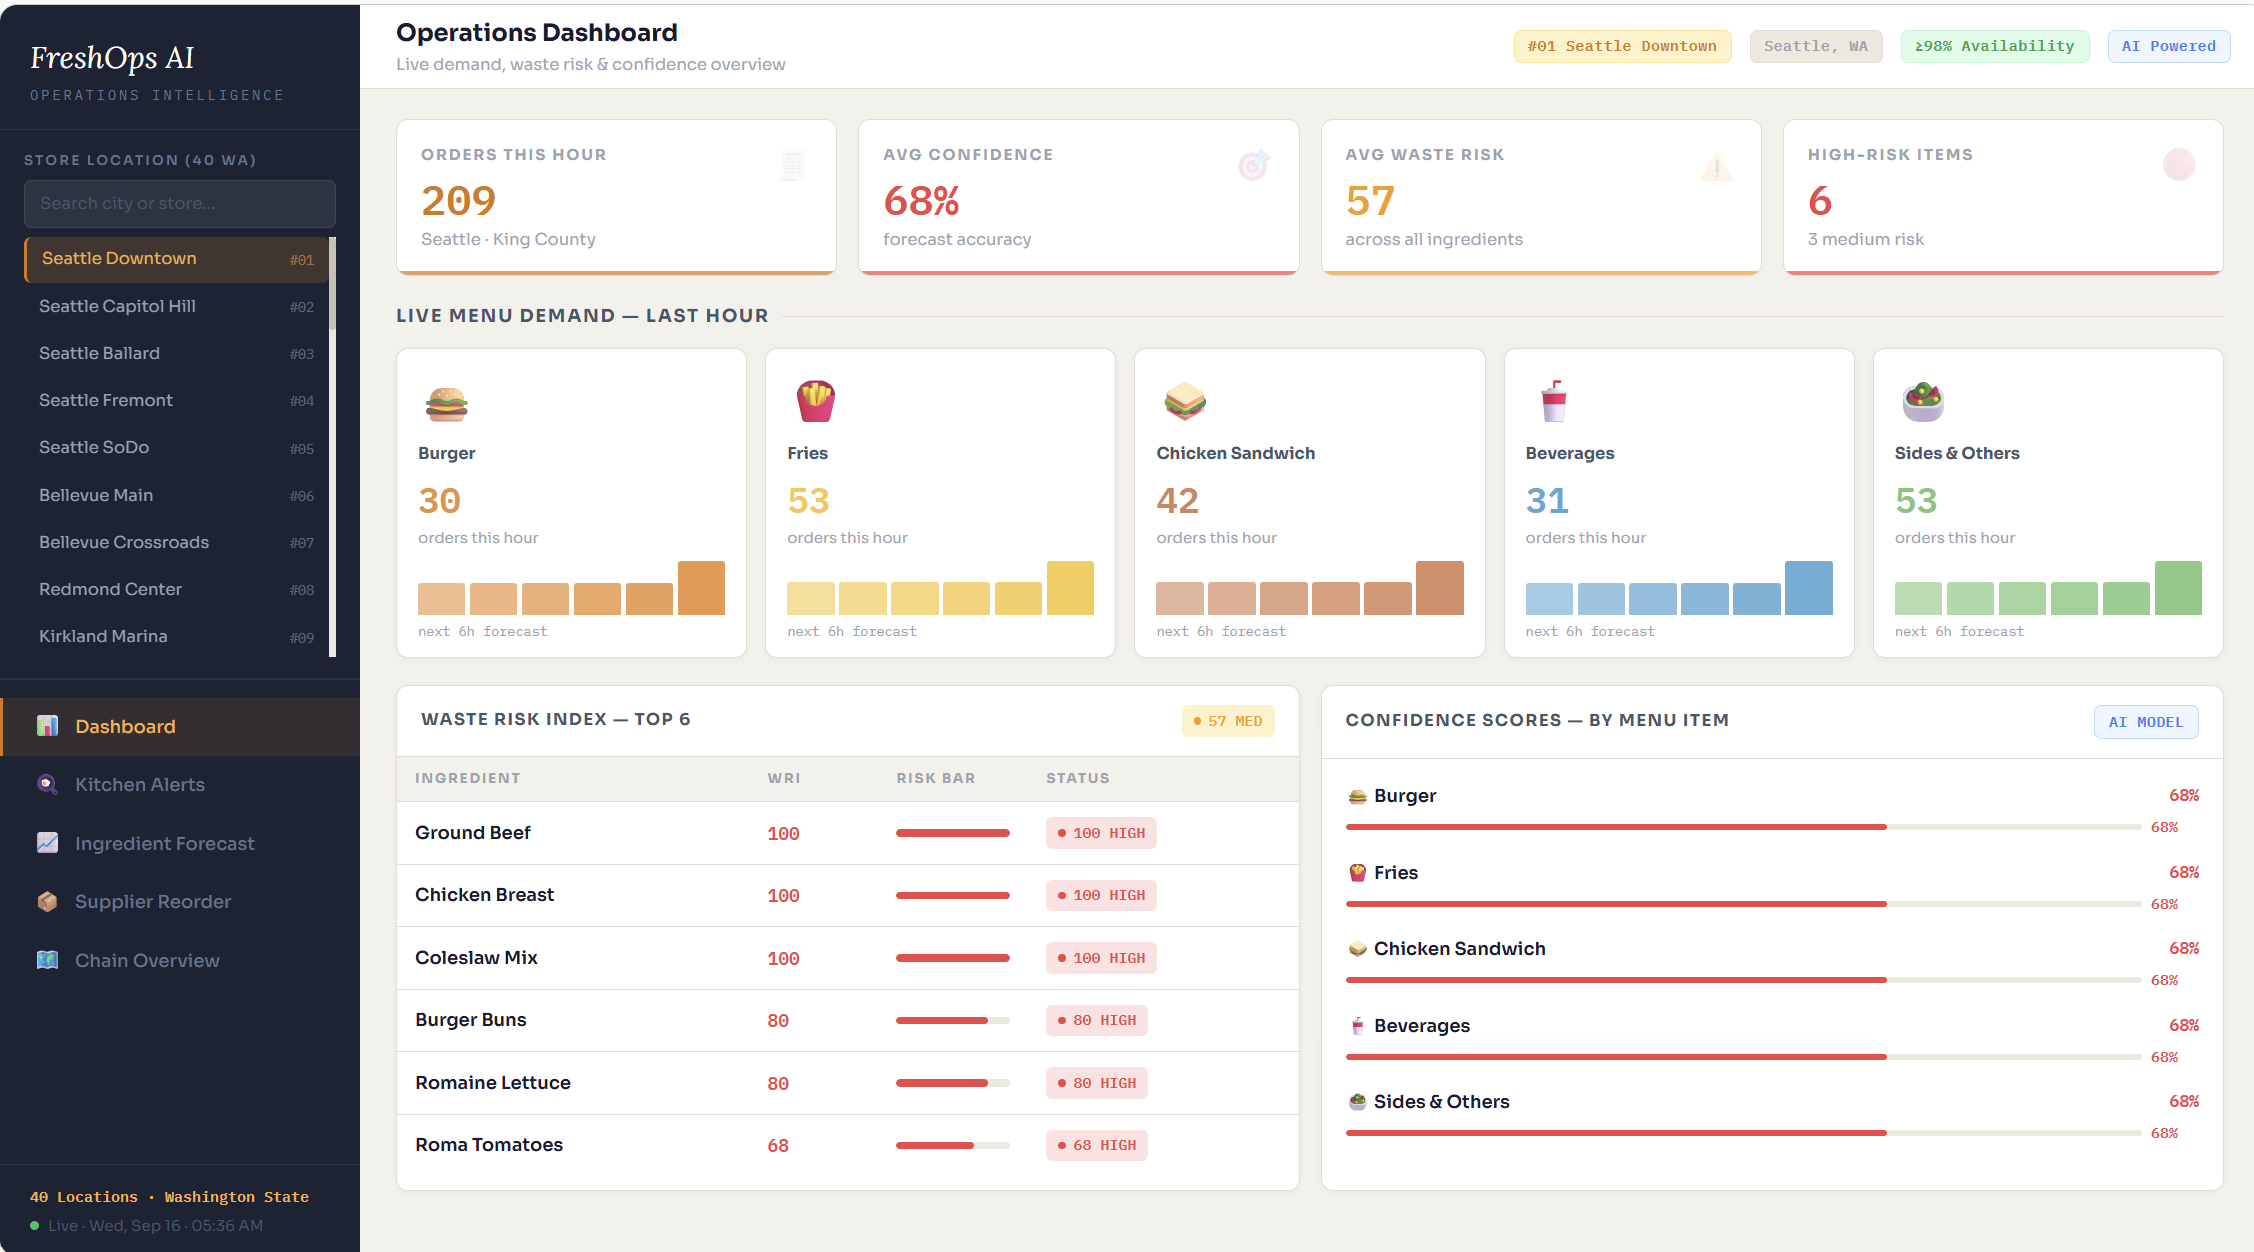
Operations Dashboard
Regional control layer for monitoring operational signals, store performance, and areas requiring attention.
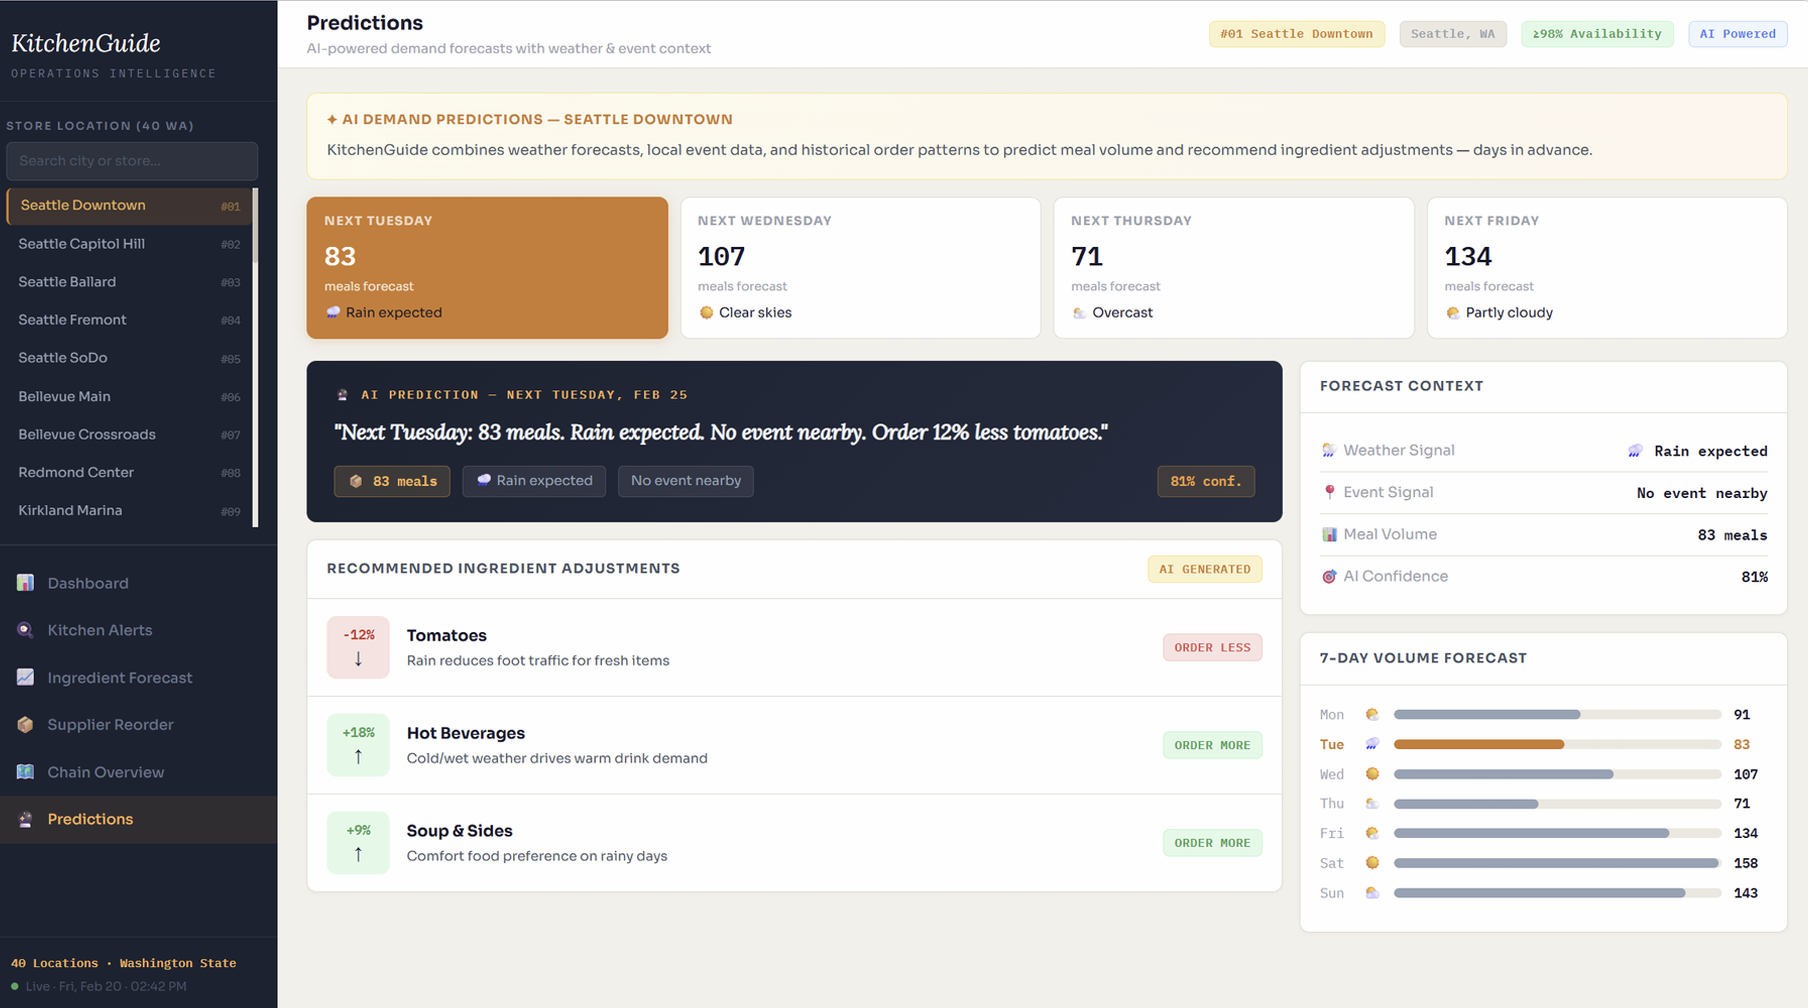
Intelligent Predictions
Decision-support experience translating demand signals into recommended operational adjustments.
07 · Success Metrics
Measure behavior before business impact
The measurement framework deliberately separates leading indicators of adoption and behavior change from lagging indicators of financial and operational impact.
Leading · Behavior Change
- →Prep-guidance adherence rate
- →Manual override rate
- →Emergency prep events
Lagging · Business Impact
- →Perishable waste cost per store
- →Stockout incidents
08
Business & Financial Model
The competition model positioned KitchenGuide as a per-store SaaS product with a land-prove-expand adoption strategy.
$300
Per Store / Month
$3,600 annually in the base competition pricing model.
$250
Volume Pricing
Modeled monthly price for larger chain deployments.
~2.6×
Modeled ROI
Based on the case assumptions of approximately $37,500 annual waste per store and 25% waste reduction.
Financial figures shown above are competition case-model assumptions and projections, not realized commercial results.
09
Launch & Change Management
Because operational AI only creates value when frontline teams use it, adoption was treated as part of the product strategy rather than a post-launch activity.
Business Readiness
Customer onboarding, compliance approval, operational reinforcement, and structured feedback from stores.
Technology Readiness
POS integration, secure data access, role-based permissions, issue resolution, and manual override capability.
Market Adoption
Pilot regional operators, demonstrate waste savings, develop case evidence, and expand from pilot stores to broader chain deployment.
Land → Prove → Expand
Pilot → Proof of savings → 40-store rollout → Multi-region expansion
10
Assumptions, Risks & Responsible Deployment
The proposal explicitly identified the dependencies and behavioral risks that could prevent a technically sound recommendation engine from delivering operational value.
Key Risks
- →Staff ignore recommendations
- →Incorrect predictions reduce trust
- →Events and promotions create operational edge cases
- →Experienced managers resist workflow changes
Mitigation
- →Show recommendation confidence
- →Roll out gradually by store
- →Preserve manual override
- →Continuously learn from operating data
11
What I Demonstrated
AI Product Strategy
Translated an operational problem into an AI-enabled decision product rather than another reporting layer.
Business Analysis
Connected users, workflows, pain points, assumptions, dependencies, and measurable business outcomes.
Product Architecture
Structured the solution across intelligence, execution, and management control layers.
Metrics & Analytics
Separated leading behavioral indicators from lagging operational and financial outcomes.
Business Modeling
Connected pricing, waste reduction assumptions, customer ROI, adoption, and modeled SaaS growth.
Change Management
Designed adoption, training, trust, override mechanisms, and rollout into the operating model.
Project note: KitchenGuide was developed for the AIMS Product Competition 2026. Financial impact, market size, waste reduction, ROI, adoption, and revenue figures shown in this case study are competition assumptions and modeled projections rather than realized customer results.